People monitor their systems for two main reasons: to keep their system healthy and to understand its performance. Almost everyone does both wrong, for the same reasons: they monitor so they can react to failures, rather than measuring their workload so that they can predict problems.
What should I use for my alert threshold?
Once people have built a monitoring system, the first thing they do is try to build an alerting system. The generally accepted strategy is to raise an alert when the system crosses a threshold like “95% disk capacity”, but this is fundamentally the wrong way to approach this problem. Many industries have realized this, but the following quote from the Nuclear Regulatory Commission’s Special Report on the incident at Three Mile Island1 most effectively captures why:
It is a difficult thing to look at a winking light on a board, or hear a peeping alarm -- let alone several of them -- and immediately draw any sort of rational picture of something happened.
A careless alert is doomed to trigger at 2am Sunday morning and cause a crisis with no immediate solution2 (it takes days to weeks for new disks to come in or hours to days for a system to rebalance). In the mad scramble to delete old backups and disable new ones, to get the system to limp along again, no one pauses to ask if the whole situation could be avoided.

Ultimately, our misguided moniteers missed the key to keeping their system healthy: they should be tracking leading indicators of poor health, not alerting on failures. If they intimately understood their usage patterns, they could get a gentle but actionable email on Tuesday afternoon warning them that their system is predicted to run out of disk capacity within a month. Then they could take preemptive action to solve this issue by reducing their workload or ordering new disks. A healthy system requires thresholds to be measured in time to resolve, not percent, so that there is always a way to avoid failures entirely.
Why did my CPU utilization spike?
People who monitor the performance of their system usually start by following two poor ad-hoc methodologies. The first strategy they employ is to iterate through the performance tools they are aware of (e.g. top, iostat, etc) and hope the issue can be seen by one of them. Brendan Gregg calls this approach the “Streetlight method” after the old joke about the man who looks for his keys in the middle of the street, rather than where he lost them, because “the light is best” under the streetlight4.
Eventually, people graduate from this strategy to a worse one; they merely track everything and plot it on the wall, hoping to spot when something changes. This method, which I’ll call “52 metric pick up”, forces people into a reactive mode that prevents them from understanding why their current workload can’t be made 2x faster unless it catastrophically fails. People follow these approaches because they are familiar, but not because they are effective.

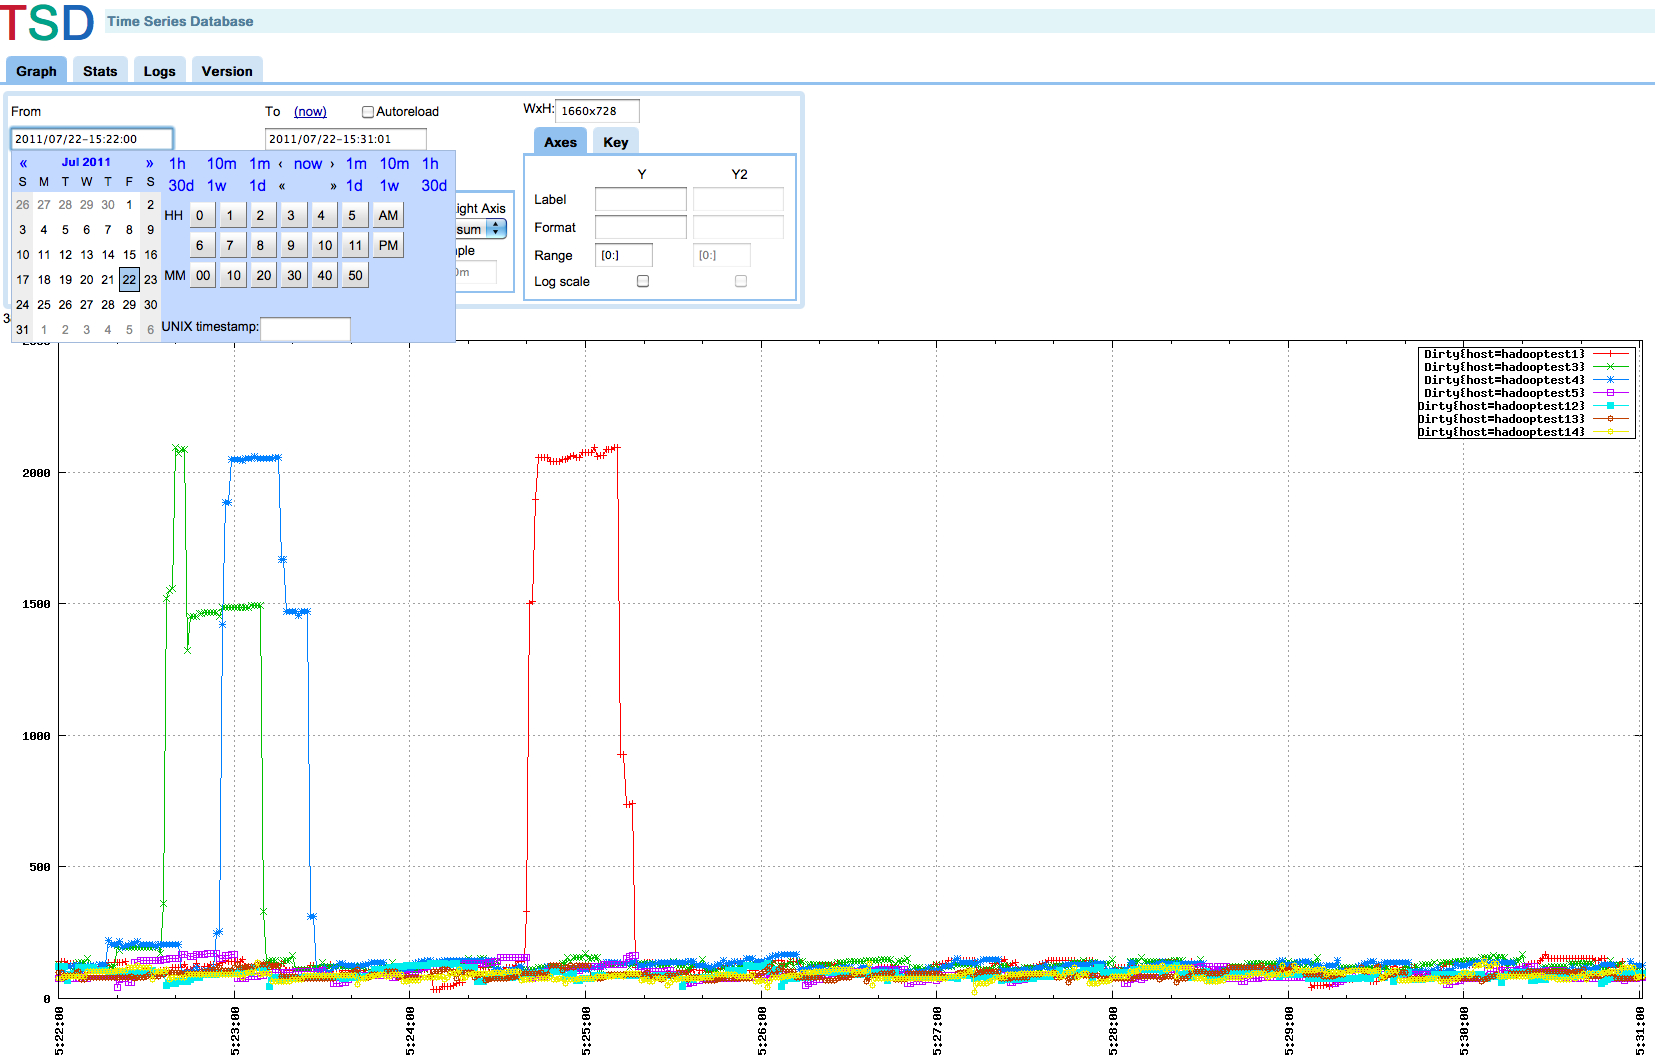
Clearly the green, blue, and red metrics were an issue in the first ⅓ of the graph, but how do I improve the last ⅓? If I need my system to do 2x better in the steady state, what should I improve?
Fortunately, the effective way to measure performance is simple: measure the high level metrics of your workload and the bottlenecks in your system. Google’s “Golden Signals” of request rate, request latency, error rate focus attention on real business objectives and are leading indicators of future issues. For these metrics, it is important to report tail latency via histograms or percentiles, rather than averages.
Resource bottlenecks can be discovered by measuring resource utilization, saturation, and errors. Most resources will queue traffic when saturated (e.g. on the scheduler run queue for CPU) but some resources will drop traffic when saturated (e.g. network interfaces require retransmits). Resource saturation will cause requests to wait, hurting overall latency and throughput.
Monitoring vs Measuring
The misguided approaches for observing both cluster health and performance fall into the same trap -- they take a reactive approach that monitors only failures. We know now we can avoid 2am alerts by predicting health issues days in advance and we can understand performance by measuring business level metrics and resource saturation to find bottlenecks. The solution in both cases is a mind shift from reacting to failures to proactively seeking leading indicators. The key difference is that the misguided approaches monitor failures and the best practices measure the system. Only by measuring an active system and predicting its future can we truly understand it.
-
This quote is from an excellent presentation by Bryan Cantrill on the ethos of debugging in production where he talks more about why alerting is not the solution. ↩
-
It is sometimes necessary to monitor internal details of a system to predict future performance issues. Alerting on internal metrics is rarely a good idea; since internal metrics are primarily used for debugging, they might not reliably point to actionable issues3. Still, such introspection can be the best leading indicator of system health or valuable for post hoc root cause analysis. Replication lag, node failures, and hung metadata operations usually presage poor query performance in a distributed system but generally require no external action, as the system is expected to recover on its own. ↩
-
Check out the excellent chapter on monitoring in the Google SRE book. ↩
-
For more anti-methods, check out Brendan Gregg's book Systems Performance: Enterprise and the Cloud. ↩
Comments !