I was advising some students in
15-418, a parallel computer
architecture and programming course at CMU. They were attempting to make a
multithreaded puzzle solver using OpenMP and had some difficulty using the CPU
profiler from Google perftools.
Basically, the profiler kept reporting that omp_get_num_procs was taking a
huge portion of the program:
$  pprof --text solver out.prof
Using local file solver.
Using local file out.prof.
Removing _L_unlock_16 from all stack traces.
Total: 1382 samples
     633  45.8%  45.8%      633  45.8% omp_get_num_procs
     283  20.5%  66.3%      283  20.5% is_complete_row
     226  16.4%  82.6%      226  16.4% partial_check_col
     102   7.4%  90.0%      744  53.8% backtrack_row_solve
      42   3.0%  93.1%       85   6.2% partial_check_row
      41   3.0%  96.0%      351  25.4% partial_check
      26   1.9%  97.9%      292  21.1% complete_and_check_puzzle
      25   1.8%  99.7%       25   1.8% is_complete_col
       3   0.2%  99.9%      749  54.2% _Z28backtrack_row_solve_paralleliiiPiPS_S0_._omp_fn.0
       1   0.1% 100.0%     1328  96.1% GOMP_taskwait
       0   0.0% 100.0%        1   0.1% GOMP_loop_dynamic_start
       0   0.0% 100.0%     1258  91.0% __clone
       0   0.0% 100.0%      124   9.0% __libc_start_main
       0   0.0% 100.0%      124   9.0% _start
       0   0.0% 100.0%      124   9.0% backtrack_row_solve_parallel
       0   0.0% 100.0%      124   9.0% backtrack_solve
       0   0.0% 100.0%      124   9.0% main
       0   0.0% 100.0%      124   9.0% solve
       0   0.0% 100.0%     1258  91.0% start_thread
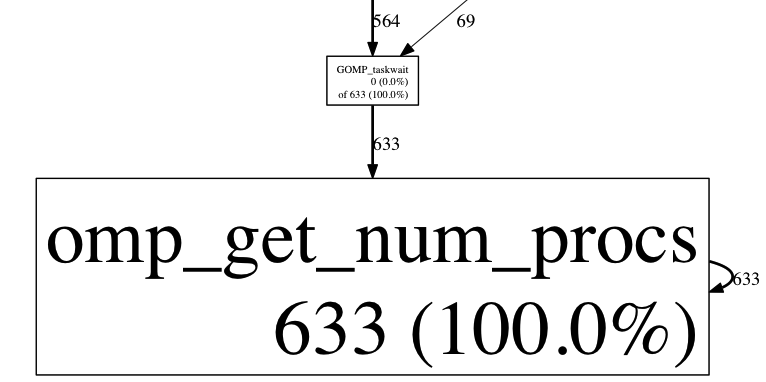
This was clearly not right, so I spent some time digging around. If we look at
the callgraph to find which functions call omp_get_num_procs, we see that the
culprit is GOMP_taskwait:
$ pprof --gv --focus=omp_get_num_procs solver out.prof

We cannot view annotated source for this function (since we don't have source), but we can look at the annotated disassembly.
$ pprof --disas=GOMP_taskwait solver out.prof
ROUTINE ====================== GOMP_taskwait
     1   1330 samples (flat, cumulative) 96.2% of total
... <snip> ...
     .     16        84ef: callq  9ca0 <omp_get_num_procs+0x540>
     .      .        84f4: nopl   0x0(%rax)
     .      .        84f8: mov    %fs:0x10(%rbx),%r13
     .      .        84fd: mov    %r12,%rdi
     .    695        8500: callq  *%rbp
     .      .        8502: lea    0x80(%r13),%rdi
     .    391        8509: callq  9b40 <omp_get_num_procs+0x3e0>
     .      .        850e: mov    %r14,%rdi
     .    156        8511: callq  9ca0 <omp_get_num_procs+0x540>
... <snip> ...
Aha! The functions are being poorly identified, so it appears that all calls to OpenMP library functions are being understood as calls to omp_get_num_procs. Unfortunately, there is nothing we can do about it - that library does not export any symbols:
$ ldd solver | grep gomp
    libgomp.so.1 => /usr/lib64/libgomp.so.1 (0x00007f19e9109000)
$ nm /usr/lib64/libgomp.so.1
nm: /usr/lib64/libgomp.so.1: no symbols
At least now why omp_get_num_threads is reported so much! We probably need to count all calls to omp_get_num_threads as 'overhead from OpenMP' but otherwise not trust the specific counts.
In my opinion, the profiler should emit function addresses
for functions that don't map to some symbol, but I understand that is hard. For now, we will get more meaningful profiling data about our code if we do:
$ pprof --text --ignore=omp_get_num_procs solver out.prof
Using local file solver.
Using local file out.prof.
Removing _L_unlock_16 from all stack traces.
Total: 1382 samples
     283  37.8%  37.8%      283  37.8% is_complete_row
     226  30.2%  68.0%      226  30.2% partial_check_col
     102  13.6%  81.6%      744  99.3% backtrack_row_solve
      42   5.6%  87.2%       85  11.3% partial_check_row
      41   5.5%  92.7%      351  46.9% partial_check
      26   3.5%  96.1%      292  39.0% complete_and_check_puzzle
      25   3.3%  99.5%       25   3.3% is_complete_col
       3   0.4%  99.9%      748  99.9% _Z28backtrack_row_solve_paralleliiiPiPS_S0_._omp_fn.0
       1   0.1% 100.0%      695  92.8% GOMP_taskwait
       0   0.0% 100.0%      694  92.7% __clone
       0   0.0% 100.0%       55   7.3% __libc_start_main
       0   0.0% 100.0%       55   7.3% _start
       0   0.0% 100.0%       55   7.3% backtrack_row_solve_parallel
       0   0.0% 100.0%       55   7.3% backtrack_solve
       0   0.0% 100.0%       55   7.3% main
       0   0.0% 100.0%       55   7.3% solve
       0   0.0% 100.0%      694  92.7% start_thread
Comments !